Automated Capacity report from PrismCentral

I have been thinking about this for a long time. Can I automate capacity reports for my executives so they can trigger a capacity report on demand? At the end of last week, I thought it was time to automate this.
Here are the details. The whole playbook is written in Ansible, and I'll walk through the steps with you.
Step1: Gather Information
First, we fetch information from Prism Central using API calls.
We start with information about the hosts in the cluster:
    # ========================================
    # Gather Host Information with Prism v1 API
    # ========================================
    - name: "Get detailed host statistics from Prism v1 API"
      ansible.builtin.uri:
        url: "https://{{ pc_ip }}:9440/PrismGateway/services/rest/v1/hosts?count=1000&projection=stats,alerts"
        method: GET
        user: "{{ vault_pc_username }}"
        password: "{{ vault_pc_password }}"
        validate_certs: false
        force_basic_auth: true
      register: hosts_stats_raw
We have the opportunity to filter the different cluster entities with extra vars if we like:
    # ========================================
    # Filter hosts based on cluster_filter
    # ========================================
    - name: "Resolve target cluster UUID from cluster_filter"
      ansible.builtin.set_fact:
        target_cluster_uuid: >-
          {{ cluster_uuid_map | dict2items
             | selectattr('value', 'equalto', cluster_filter)
             | map(attribute='key') | first }}
      when: cluster_filter != ""

    - name: "Filter hosts - only target cluster"
      ansible.builtin.set_fact:
        filtered_hosts: >-
          {{ hosts_stats_raw.json.entities
             | selectattr('clusterUuid', 'equalto', target_cluster_uuid) | list }}
      when: cluster_filter != ""

    - name: "Use all hosts (no filter)"
      ansible.builtin.set_fact:
        filtered_hosts: "{{ hosts_stats_raw.json.entities }}"
      when: cluster_filter == ""

    - name: "Group filtered hosts by clusterUuid"
      ansible.builtin.set_fact:
        hosts_by_cluster: "{{ filtered_hosts | groupby('clusterUuid') | map('list') | list }}"
Then we fetch all the different VMs:
# ========================================
    # Fetch all VMs (incl. CVMs) per cluster via Prism v1 API
    # Note: Prism Central v3 / NCP module does not return CVMs,
    # so the v1 API is used instead, which includes controller VMs.
    # ========================================
    # CPU:    numVCpus is summed directly from the v1 response.
    # Memory: CVM memory is tracked separately to be included in the used calculation.
    # ========================================
    - name: "Fetch all VMs including CVMs per cluster via Prism v1 API"
      ansible.builtin.uri:
        url: "https://{{ pc_ip }}:9440/PrismGateway/services/rest/v1/vms?count=20000&proxyClusterUuid={{ item[0] }}"
        method: GET
        user: "{{ vault_pc_username }}"
        password: "{{ vault_pc_password }}"
        validate_certs: false
        force_basic_auth: true
      register: v1_vms_raw
      loop: "{{ hosts_by_cluster }}"
      loop_control:
        label: "{{ cluster_uuid_map[item[0]] | default(item[0]) }}"

    - name: "Build dict: cluster_uuid -> total vCPUs and CVM memory"
      ansible.builtin.set_fact:
        vcpu_by_cluster: >-
          {{ vcpu_by_cluster | default({}) | combine({
               item.item[0]: item.json.entities | map(attribute='numVCpus') | sum
             }) }}
        cvm_mem_by_cluster: >-
          {{ cvm_mem_by_cluster | default({}) | combine({
               item.item[0]: item.json.entities | selectattr('controllerVm', 'equalto', true)
                             | map(attribute='memoryCapacityInBytes') | sum
             }) }}
        num_vms_by_cluster: >-
          {{ num_vms_by_cluster | default({}) | combine({
               item.item[0]: item.json.entities | selectattr('controllerVm', 'equalto', false) | list | length
             }) }}
      loop: "{{ v1_vms_raw.results }}"
      loop_control:
        label: "{{ cluster_uuid_map[item.item[0]] | default(item.item[0]) }}"
Then we fetch the storage metrics:
    # ========================================
    # Fetch exact storage values via the Prism v2.0 cluster API
    # Values match the GUI exactly (resilient, used, free).
    # Rebuild reservation = raw capacity - resilient capacity.
    # ========================================
    - name: "Fetch v2.0 cluster storage stats"
      ansible.builtin.uri:
        url: "https://{{ pc_ip }}:9440/PrismGateway/services/rest/v2.0/cluster/?proxyClusterUuid={{ item[0] }}"
        method: GET
        user: "{{ vault_pc_username }}"
        password: "{{ vault_pc_password }}"
        validate_certs: false
        force_basic_auth: true
      register: v2_cluster_raw
      loop: "{{ hosts_by_cluster }}"
      loop_control:
        label: "{{ cluster_uuid_map[item[0]] | default(item[0]) }}"

    - name: "Build dict: cluster_uuid -> v2.0 storage stats"
      ansible.builtin.set_fact:
        storage_by_cluster: >-
          {{ storage_by_cluster | default({}) | combine({
               item.item[0]: item.json.usage_stats
             }) }}
      loop: "{{ v2_cluster_raw.results }}"
      loop_control:
        label: "{{ cluster_uuid_map[item.item[0]] | default(item.item[0]) }}"

    - name: "Build dict: cluster_uuid -> VM provisioned disk bytes"
      ansible.builtin.set_fact:
        vm_disk_prov_by_cluster: >-
          {{ vm_disk_prov_by_cluster | default({}) | combine({
               item.item[0]: item.json.entities
                             | selectattr('controllerVm', 'equalto', false)
                             | map(attribute='diskCapacityInBytes') | sum
             }) }}
      loop: "{{ v1_vms_raw.results }}"
      loop_control:
        label: "{{ cluster_uuid_map[item.item[0]] | default(item.item[0]) }}"
Then we fetch Volume Groups per cluster:
    # ========================================
    # Fetch Volume Groups per cluster via Prism v2.0 API
    # Sums disk_list[].vmdisk_size_bytes per cluster.
    # ========================================
    - name: "Fetch Volume Groups per cluster via v2.0 API"
      ansible.builtin.uri:
        url: "https://{{ pc_ip }}:9440/PrismGateway/services/rest/v2.0/volume_groups/?proxyClusterUuid={{ item[0] }}&count=2000"
        method: GET
        user: "{{ vault_pc_username }}"
        password: "{{ vault_pc_password }}"
        validate_certs: false
        force_basic_auth: true
      register: v2_vg_raw
      loop: "{{ hosts_by_cluster }}"
      loop_control:
        label: "{{ cluster_uuid_map[item[0]] | default(item[0]) }}"

    - name: "Build dict: cluster_uuid -> VG provisioned disk bytes"
      ansible.builtin.set_fact:
        vg_disk_prov_by_cluster: >-
          {{ vg_disk_prov_by_cluster | default({}) | combine({
               item.item[0]: item.json.entities
                             | map(attribute='disk_list') | flatten
                             | map(attribute='vmdisk_size_bytes') | map('int') | sum
             }) }}
        num_vgs_by_cluster: >-
          {{ num_vgs_by_cluster | default({}) | combine({
               item.item[0]: item.json.entities | length
             }) }}
      loop: "{{ v2_vg_raw.results }}"
      loop_control:
        label: "{{ cluster_uuid_map[item.item[0]] | default(item.item[0]) }}"
Then we fetch trend stats, using the same API calls as the Graphs:
    # ========================================
    # Fetch time-series trend stats per cluster (last 90 days, 6h intervals)
    # Metrics: CPU usage (ppm), Memory usage (ppm), Storage usage (bytes)
    # ========================================
    - name: "Calculate stats time range (last 90 days)"
      ansible.builtin.set_fact:
        stats_end_usecs: "{{ (now().strftime('%s') | int) * 1000000 }}"
        stats_start_usecs: "{{ ((now().strftime('%s') | int) - 7776000) * 1000000 }}"

    - name: "Fetch cluster trend stats per cluster"
      ansible.builtin.uri:
        url: "https://{{ pc_ip }}:9440/PrismGateway/services/rest/v1/cluster/stats?metrics=hypervisor_cpu_usage_ppm%2Chypervisor_memory_usage_ppm%2Cstorage.usage_bytes&startTimeInUsecs={{ stats_start_usecs }}&endTimeInUsecs={{ stats_end_usecs }}&intervalInSecs=300&proxyClusterUuid={{ item[0] }}"
        method: GET
        user: "{{ vault_pc_username }}"
        password: "{{ vault_pc_password }}"
        validate_certs: false
        force_basic_auth: true
      register: v1_cluster_stats_raw
      loop: "{{ hosts_by_cluster }}"
      loop_control:
        label: "{{ cluster_uuid_map[item[0]] | default(item[0]) }}"

    - name: "Build dict: cluster_uuid -> trend stats"
      ansible.builtin.set_fact:
        trend_by_cluster: >-
          {{ trend_by_cluster | default({}) | combine({
               item.item[0]: {
                 'cpu':     item.json.statsSpecificResponses
                            | selectattr('metric', 'equalto', 'hypervisor_cpu_usage_ppm')
                            | map(attribute='values') | first | default([]),
                 'mem':     item.json.statsSpecificResponses
                            | selectattr('metric', 'equalto', 'hypervisor_memory_usage_ppm')
                            | map(attribute='values') | first | default([]),
                 'storage': item.json.statsSpecificResponses
                            | selectattr('metric', 'equalto', 'storage.usage_bytes')
                            | map(attribute='values') | first | default([])
               }
             }) }}
      loop: "{{ v1_cluster_stats_raw.results }}"
      loop_control:
        label: "{{ cluster_uuid_map[item.item[0]] | default(item.item[0]) }}"
Then we calculate memory usage and remove HA reserved capacity if any:
    # ========================================
    # Calculate used memory and HA reservation per cluster
    # Used memory: weighted sum of hypervisor_memory_usage_ppm * host capacity
    # HA reservation: max(host.memoryCapacityInBytes) per cluster
    # ========================================
    - name: "Reset memory accumulators"
      ansible.builtin.set_fact:
        mem_used_bytes_by_cluster: {}
        ha_reserved_by_cluster: {}
        cvm_mem_by_cluster: "{{ cvm_mem_by_cluster | default({}) }}"

    - name: "Accumulate used memory and HA reservation per cluster"
      ansible.builtin.set_fact:
        mem_used_bytes_by_cluster: >-
          {{ mem_used_bytes_by_cluster | combine({
               item.clusterUuid: (mem_used_bytes_by_cluster[item.clusterUuid] | default(0) | float) +
                                 (item.stats.hypervisor_memory_usage_ppm | float / 1000000.0 * item.memoryCapacityInBytes | float)
             }) }}
        ha_reserved_by_cluster: >-
          {{ ha_reserved_by_cluster | combine({
               item.clusterUuid: [ha_reserved_by_cluster[item.clusterUuid] | default(0) | float,
                                  item.memoryCapacityInBytes | float] | max
             }) }}
      loop: "{{ filtered_hosts }}"
      loop_control:
        label: "{{ item.name }}"
Then we correlate all the data per cluster:
    # ========================================
    # Capacity report per cluster
    # ========================================

    # Build a structured list of cluster metrics used by both the
    # console summary below and the HTML email template.
    - name: "Build cluster report data"
      vars:
        cluster_hosts: "{{ item[1] }}"
        physical_cores: "{{ cluster_hosts | map(attribute='numCpuCores') | sum }}"
        total_cpu_ghz: "{{ (physical_cores | int * (cluster_hosts | map(attribute='cpuFrequencyInHz') | map('float') | sum / cluster_hosts | length) / 1e9) | round(2) }}"
        cpu_usage_pct: "{{ (cluster_hosts | map(attribute='stats.hypervisor_cpu_usage_ppm') | map('float') | sum / cluster_hosts | length / 10000) | round(2) }}"
        storage_raw_bytes: "{{ cluster_hosts | json_query('[].usageStats.\"storage.capacity_bytes\"') | map('int') | sum }}"
      ansible.builtin.set_fact:
        report_clusters: >-
          {{ report_clusters | default([]) + [{
               'name':             cluster_uuid_map[item[0]] | default(item[0]),
               'num_hosts':        cluster_hosts | length,
               'num_vms':          num_vms_by_cluster[item[0]] | default(0) | int,
               'num_vgs':          num_vgs_by_cluster[item[0]] | default(0) | int,
               'host_models':      cluster_hosts | map(attribute='blockModelName') | list,
               'physical_cores':   cluster_hosts | map(attribute='numCpuCores') | sum,
               'total_cpu_ghz':    total_cpu_ghz,
               'cpu_usage_pct':    cpu_usage_pct,
               'used_cpu_ghz':     (total_cpu_ghz | float * cpu_usage_pct | float / 100) | round(2),
               'vcpu_provisioned': vcpu_by_cluster[item[0]] | int,
               'physical_mem_gb':  (cluster_hosts | map(attribute='memoryCapacityInBytes') | sum / 1024 / 1024 / 1024) | round(2),
               'ha_reserved_gb':   (ha_reserved_by_cluster[item[0]] | default(0) | float / 1024 / 1024 / 1024) | round(2),
               'mem_effective_gb': ((cluster_hosts | map(attribute='memoryCapacityInBytes') | sum | float - ha_reserved_by_cluster[item[0]] | default(0) | float) / 1024 / 1024 / 1024) | round(2),
               'mem_used_gb':      ((mem_used_bytes_by_cluster[item[0]] | float + cvm_mem_by_cluster[item[0]] | default(0) | float) / 1024 / 1024 / 1024) | round(2),
               'mem_usage_pct':    ((mem_used_bytes_by_cluster[item[0]] | float + cvm_mem_by_cluster[item[0]] | default(0) | float) / (cluster_hosts | map(attribute='memoryCapacityInBytes') | sum | float) * 100) | round(2),
               'mem_free_gb':      ((cluster_hosts | map(attribute='memoryCapacityInBytes') | sum | float - mem_used_bytes_by_cluster[item[0]] | float - cvm_mem_by_cluster[item[0]] | default(0) | float) / 1024 / 1024 / 1024) | round(2),
               'storage_raw_tib':  (storage_raw_bytes | float / 1024 / 1024 / 1024 / 1024) | round(2),
               'storage_rebuild_tib': (storage_raw_bytes | float / 1024 / 1024 / 1024 / 1024 - storage_by_cluster[item[0]]['storage.capacity_bytes'] | int / 1024 / 1024 / 1024 / 1024) | round(2),
               'storage_cap_tib':  (storage_by_cluster[item[0]]['storage.capacity_bytes'] | int / 1024 / 1024 / 1024 / 1024) | round(2),
               'storage_used_tib': (storage_by_cluster[item[0]]['storage.usage_bytes'] | int / 1024 / 1024 / 1024 / 1024) | round(2),
               'storage_used_pct': (storage_by_cluster[item[0]]['storage.usage_bytes'] | int / storage_by_cluster[item[0]]['storage.capacity_bytes'] | int * 100) | round(2),
               'storage_free_tib': (storage_by_cluster[item[0]]['storage.free_bytes'] | int / 1024 / 1024 / 1024 / 1024) | round(2),
               'total_prov_tib':   ((vm_disk_prov_by_cluster[item[0]] | default(0) | float + vg_disk_prov_by_cluster[item[0]] | default(0) | float) / 1024 / 1024 / 1024 / 1024) | round(2),
               'cpu_trend':        trend_by_cluster[item[0]].cpu | default([]),
               'mem_trend':        trend_by_cluster[item[0]].mem | default([]),
               'storage_trend':    trend_by_cluster[item[0]].storage | default([]),
               'storage_cap_bytes': storage_by_cluster[item[0]]['storage.capacity_bytes'] | int
             }] }}
      loop: "{{ hosts_by_cluster }}"
      loop_control:
        label: "{{ cluster_uuid_map[item[0]] | default(item[0]) }}"
Then we use matplotlib to generate graphs to attach to the email:
    # ========================================
    # Generate PNG chart images (base64) via Python/matplotlib
    # ========================================
    - name: "Write chart input data to temp file"
      ansible.builtin.copy:
        content: "{{ report_clusters | to_json }}"
        dest: "/tmp/nutanix_chart_input.json"

    - name: "Generate PNG chart images for email"
      ansible.builtin.shell:
        cmd: "python3.12 {{ playbook_dir }}/scripts/generate_charts.py < /tmp/nutanix_chart_input.json"
      register: charts_raw

    - name: "Remove chart input temp file"
      ansible.builtin.file:
        path: "/tmp/nutanix_chart_input.json"
        state: absent

    - name: "Embed chart images in report_clusters"
      ansible.builtin.set_fact:
        report_clusters_with_charts: >-
          {{ report_clusters_with_charts | default([]) + [
               item | combine({
                 'cpu_chart':          (charts_raw.stdout | from_json)[item.name]['cpu_chart'],
                 'mem_chart':          (charts_raw.stdout | from_json)[item.name]['mem_chart'],
                 'storage_chart':      (charts_raw.stdout | from_json)[item.name]['storage_chart'],
                 'cpu_chart_dark':     (charts_raw.stdout | from_json)[item.name]['cpu_chart_dark'],
                 'mem_chart_dark':     (charts_raw.stdout | from_json)[item.name]['mem_chart_dark'],
                 'storage_chart_dark': (charts_raw.stdout | from_json)[item.name]['storage_chart_dark']
               })
             ] }}
      loop: "{{ report_clusters }}"
      loop_control:
        label: "{{ item.name }}"

    - name: "Replace report_clusters with chart-enhanced version"
      ansible.builtin.set_fact:
        report_clusters: "{{ report_clusters_with_charts }}"
Lastly, we send everything in an email:
    # ========================================
    # Send capacity report as HTML email
    # Recipient: ansibleforms_user.username (set by AnsibleForms)
    # ========================================
    - name: "Create temporary file for capacity report email"
      ansible.builtin.tempfile:
        state: file
        suffix: _capacity_report.html
      register: report_email_file
      when:
        - ansibleforms_user is defined
        - ansibleforms_user.username is defined

    - name: "Render capacity report HTML email from template"
      ansible.builtin.template:
        src: "email_capacity_report.html.j2"
        dest: "{{ report_email_file.path }}"
      when:
        - ansibleforms_user is defined
        - ansibleforms_user.username is defined

    - name: "Send capacity report email"
      community.general.mail:
        host: <YOUR SMTP SERVER HERE>
        port: 25
        from: <FROM>
        to: "{{ email_address }}"
        subject: "Nutanix Capacity Report - {{ now().strftime('%Y-%m-%d') }}"
        subtype: html
        body: "{{ lookup('file', report_email_file.path) }}"
      when:
        - ansibleforms_user is defined
        - ansibleforms_user.username is defined
      ignore_errors: true
The file we use to generate the report is email_capacity_report.html.j2, with the following content:
<!DOCTYPE html>
<html>
<head>
<meta charset="UTF-8">
<style>
body { font-family: Arial, sans-serif; background-color: #f4f4f4; padding: 20px; margin: 0; }
.container { background-color: white; padding: 30px; border-radius: 8px; max-width: 900px; margin: 0 auto; }
h1 { color: #333; border-bottom: 0.1px solid #e0e0e0; padding-bottom: 10px; font-size: 20px; margin: 0 0 4px 0; }
.report-sub { color: #888; font-size: 12px; margin: 0 0 24px 0; }
h2 { color: #333; padding-bottom: 10px; font-size: 17px; margin: 32px 0 0 0; }
h3 { color: #333; border-bottom: 1px solid #e0e0e0; padding-bottom: 6px; font-size: 14px; margin: 20px 0 0 0; }
.data-table { width: 100%; border-collapse: collapse; margin: 0; }
.trend-label { color: #333; font-size: 13px; font-weight: bold; margin: 18px 0 4px 0; }
.footer { margin-top: 30px; padding-top: 20px; border-top: 1px solid #e0e0e0; color: #666; font-size: 12px; }
    .chart-dark  { display: none; }
    .chart-light { display: block; }
    @media (prefers-color-scheme: dark) {
      .chart-dark  { display: block !important; }
      .chart-light { display: none !important; }
}
</style>
</head>
<body>
<table cellpadding="0" cellspacing="0" border="0" width="100%" bgcolor="#f4f4f4" style="background-color:#f4f4f4;">
<tr>
<td align="center" style="padding:20px 0;">
<table cellpadding="0" cellspacing="0" border="0" width="900" style="max-width:900px;width:100%;background-color:#ffffff;border-radius:8px;" bgcolor="#ffffff">
<tr><td style="padding:30px;">
<div class="container" style="background:none;padding:0;border-radius:0;max-width:none;margin:0;">
<h1>Nutanix Capacity Report</h1>
<p class="report-sub">Generated: {{ now().strftime('%Y-%m-%d %H:%M') }} · Trend: last 90 days</p>
{# Compute date labels once for all charts #}
{% set _end_ts = now().timestamp() | int %}
{% set _start_ts = _end_ts - 7776000 %}
{% set _mid_ts = _end_ts - 3888000 %}
{% set d_start = '%d %b' | strftime(_start_ts) %}
{% set d_mid = '%d %b' | strftime(_mid_ts) %}
{% set d_end = '%d %b' | strftime(_end_ts) %}
{% macro chart_img(b64, b64_dark) %}
{% if b64 %}
<table cellpadding="0" cellspacing="0" border="0" style="width:100%;border-collapse:collapse;margin:6px 0 14px 0;">
<tr>
<td width="26" style="vertical-align:top;padding:0 6px 0 0;border:none;">
<table cellpadding="0" cellspacing="0" border="0" height="110" style="width:100%;border-collapse:collapse;">
<tr height="10"><td style="vertical-align:top;font-size:9px;color:#999;font-family:Arial,sans-serif;line-height:1;text-align:right;white-space:nowrap;padding:0;border:none;">100%</td></tr>
<tr height="90"><td style="font-size:9px;color:#999;font-family:Arial,sans-serif;text-align:right;vertical-align:middle;white-space:nowrap;padding:0;border:none;">50%</td></tr>
<tr height="10"><td style="vertical-align:bottom;font-size:9px;color:#999;font-family:Arial,sans-serif;line-height:1;text-align:right;white-space:nowrap;padding:0;border:none;">0%</td></tr>
</table>
</td>
<td style="vertical-align:bottom;padding:0;border:none;">
<img src="data:image/png;base64,{{ b64 }}" width="840" height="110" alt="" style="display:block;width:100%;height:110px;" border="0" class="chart-light">
<!--[if !mso]><!--><img src="data:image/png;base64,{{ b64_dark }}" width="840" height="110" alt="" style="display:none;width:100%;height:110px;" border="0" class="chart-dark"><!--<![endif]-->
<table cellpadding="0" cellspacing="0" border="0" width="100%" style="width:100%;border-collapse:collapse;margin-top:3px;table-layout:fixed;">
<tr>
<td width="33%" style="padding:0;border:none;font-size:9px;color:#999;font-family:Arial,sans-serif;text-align:left;overflow:hidden;">{{ d_start }}</td>
<td width="34%" style="padding:0;border:none;font-size:9px;color:#999;font-family:Arial,sans-serif;text-align:center;overflow:hidden;">{{ d_mid }}</td>
<td width="33%" style="padding:0;border:none;font-size:9px;color:#999;font-family:Arial,sans-serif;text-align:right;overflow:hidden;">{{ d_end }}</td>
</tr>
</table>
</td>
</tr>
</table>
{% endif %}
{% endmacro %}
{% set TH = "text-align:left;padding:8px 10px;font-weight:normal;color:#666;width:40%;border:none;border-bottom:1px solid #ececec;font-family:Arial,sans-serif;font-size:13px;" %}
{% set TD = "padding:8px 10px;border:none;border-bottom:1px solid #ececec;color:#333;font-family:Arial,sans-serif;font-size:13px;" %}
{% set TH_L = "text-align:left;padding:8px 10px;font-weight:normal;color:#666;width:40%;border:none;font-family:Arial,sans-serif;font-size:13px;" %}
{% set TD_L = "padding:8px 10px;border:none;color:#333;font-family:Arial,sans-serif;font-size:13px;" %}
{% for c in report_clusters %}
<h2>{{ c.name }}</h2>
<h3>Cluster Information</h3>
<table class="data-table" width="100%" cellpadding="0" cellspacing="0" border="0">
<tr><th style="{{ TH }}">Hosts</th><td style="{{ TD }}">{{ c.num_hosts }}</td></tr>
<tr><th style="{{ TH }}">Virtual Machines</th><td style="{{ TD }}">{{ c.num_vms }}</td></tr>
<tr><th style="{{ TH }}">Volume Groups</th><td style="{{ TD }}">{{ c.num_vgs }}</td></tr>
<tr><th style="{{ TH_L }}">Host models</th><td style="{{ TD_L }}">{% for model in c.host_models | unique %}{{ c.host_models | select('equalto', model) | list | length }}x {{ model }}{% if not loop.last %}<br>{% endif %}{% endfor %}</td></tr>
</table>
<h3>CPU</h3>
<table class="data-table" width="100%" cellpadding="0" cellspacing="0" border="0">
<tr><th style="{{ TH }}">Physical cores</th><td style="{{ TD }}">{{ c.physical_cores }}</td></tr>
<tr><th style="{{ TH }}">Total capacity</th><td style="{{ TD }}">{{ c.total_cpu_ghz }} GHz</td></tr>
<tr><th style="{{ TH }}">Used (avg)</th><td style="{{ TD }}">{{ c.used_cpu_ghz }} GHz ({{ c.cpu_usage_pct }}%)</td></tr>
<tr><th style="{{ TH }}">Provisioned vCPUs</th><td style="{{ TD }}">{{ c.vcpu_provisioned }}</td></tr>
<tr><th style="{{ TH_L }}">vCPU / pCPU ratio</th><td style="{{ TD_L }}">{{ (c.vcpu_provisioned | int / c.physical_cores | int) | round(2) }}:1</td></tr>
</table>
<p class="trend-label">CPU usage trend (90 days)</p>
{{ chart_img(c.cpu_chart, c.cpu_chart_dark) }}
<h3>Memory</h3>
<table class="data-table" width="100%" cellpadding="0" cellspacing="0" border="0">
<tr><th style="{{ TH }}">Physical memory</th><td style="{{ TD }}">{{ c.physical_mem_gb }} GiB</td></tr>
<tr><th style="{{ TH }}">HA reservation</th><td style="{{ TD }}">− {{ c.ha_reserved_gb }} GiB</td></tr>
<tr><th style="{{ TH }}">Effective available</th><td style="{{ TD }}">{{ c.mem_effective_gb }} GiB</td></tr>
<tr><th style="{{ TH }}">Used (avg)</th><td style="{{ TD }}">{{ c.mem_used_gb }} GiB ({{ c.mem_usage_pct }}%)</td></tr>
<tr><th style="{{ TH_L }}">Free (avg)</th><td style="{{ TD_L }}">{{ c.mem_free_gb }} GiB</td></tr>
</table>
<p class="trend-label">Memory usage trend (90 days)</p>
{{ chart_img(c.mem_chart, c.mem_chart_dark) }}
<h3>Storage</h3>
<table class="data-table" width="100%" cellpadding="0" cellspacing="0" border="0">
<tr><th style="{{ TH }}">Raw capacity</th><td style="{{ TD }}">{{ c.storage_raw_tib }} TiB</td></tr>
<tr><th style="{{ TH }}">Rebuild reservation</th><td style="{{ TD }}">− {{ c.storage_rebuild_tib }} TiB</td></tr>
<tr><th style="{{ TH }}">Resilient capacity</th><td style="{{ TD }}">{{ c.storage_cap_tib }} TiB</td></tr>
<tr><th style="{{ TH }}">Used</th><td style="{{ TD }}">{{ c.storage_used_tib }} TiB ({{ c.storage_used_pct }}%)</td></tr>
<tr><th style="{{ TH }}">Available</th><td style="{{ TD }}">{{ c.storage_free_tib }} TiB</td></tr>
<tr><th style="{{ TH_L }}">Total provisioned</th><td style="{{ TD_L }}">{{ c.total_prov_tib }} TiB</td></tr>
</table>
<p class="trend-label">Storage usage trend (90 days)</p>
{{ chart_img(c.storage_chart, c.storage_chart_dark) }}
{% endfor %}
<div class="footer">
<p>Med vänlig hälsning,<br>AWX Automation</p>
</div>
</div>
</td></tr>
</table>
</td>
</tr>
</table>
</body>
</html>Problems during development
During development, I encountered a lot of different problems.
Phase 1: Data gathering.
The data received from the Nutanix Ansible NCP module did not match what was presented in the GUI. This was mainly because we did not get the CVMs, so we used developer tools to see what API calls the GUI uses and used the exact same calls.
We also had problems calculating the resilient Memory and Storage capacity using only the nutanix.ncp Ansible modules. That's why, for now, we're using the same API calls as the Prism Central GUI.
Phase 2: Graph generation
Problem 1 — Area charts invisible in different Outlook versions
Outlook Windows reading pane and also Legacy Outlook on Windows use the Word rendering engine. First, we tried to render the graphs with tables in HTML, but that looked awful, so we switched to generating the graphs with the Python libraries matplotlib and numpy. Then we faced issues where different email clients handle PNG transparency incorrectly—transparent fills are composited against a white background and disappear. We solved this by moving on to using single-colored graphs.
Problem 2 — Different look and feel in dark vs light mode
We first generated the same graphs for both dark and light mode, but this looked awful, so we decided to generate different graphs based on light or dark mode. Solved that with CSS:
.chart-dark { display: none; }
.chart-light { display: block; }
@media (prefers-color-scheme: dark) {
.chart-dark { display: block !important; }
.chart-light { display: none !important; }The biggest issue during development was getting it to look the same in all different Outlook clients.
Mac was never a problem, but both Legacy and New Outlook on Windows were hard to get working. 😦
The end result
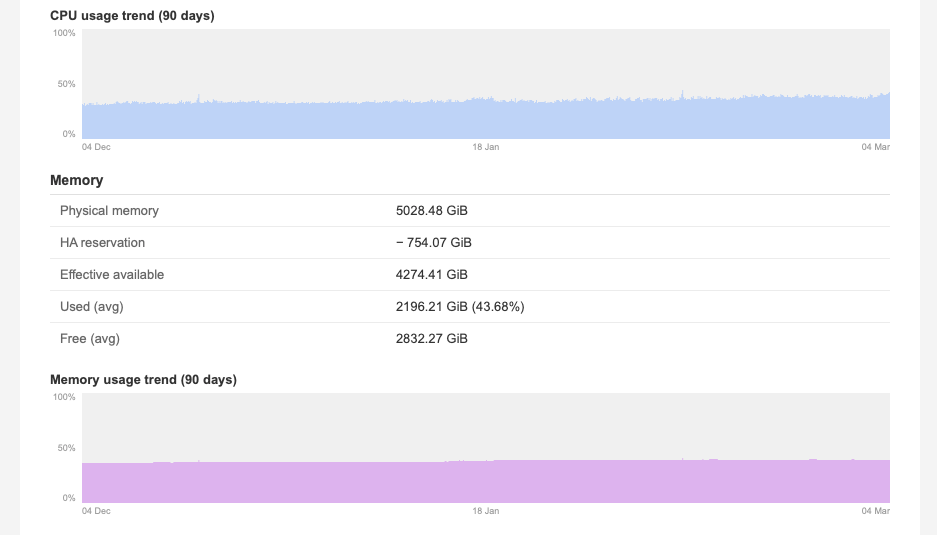
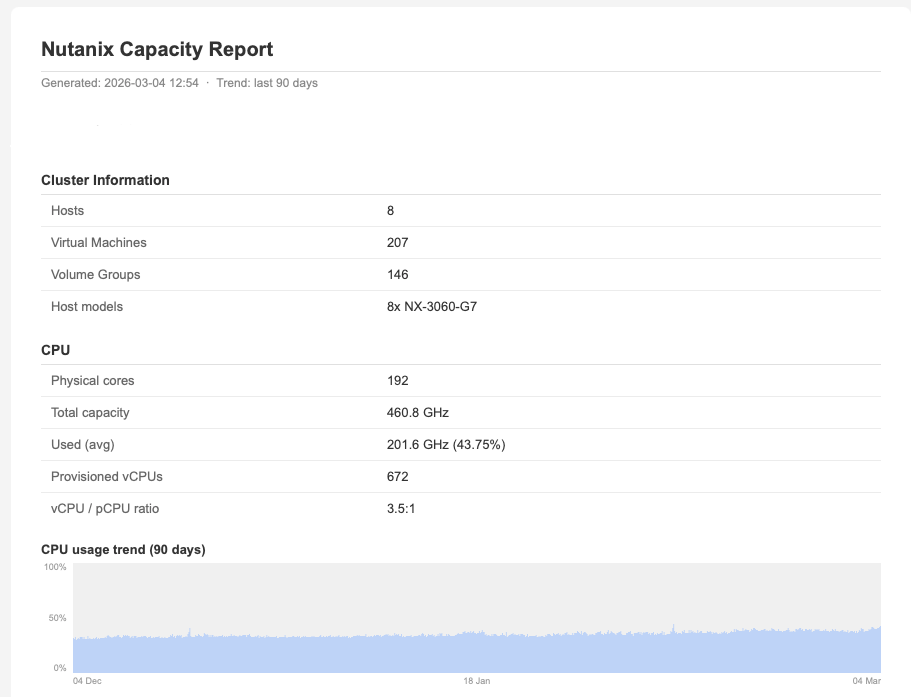
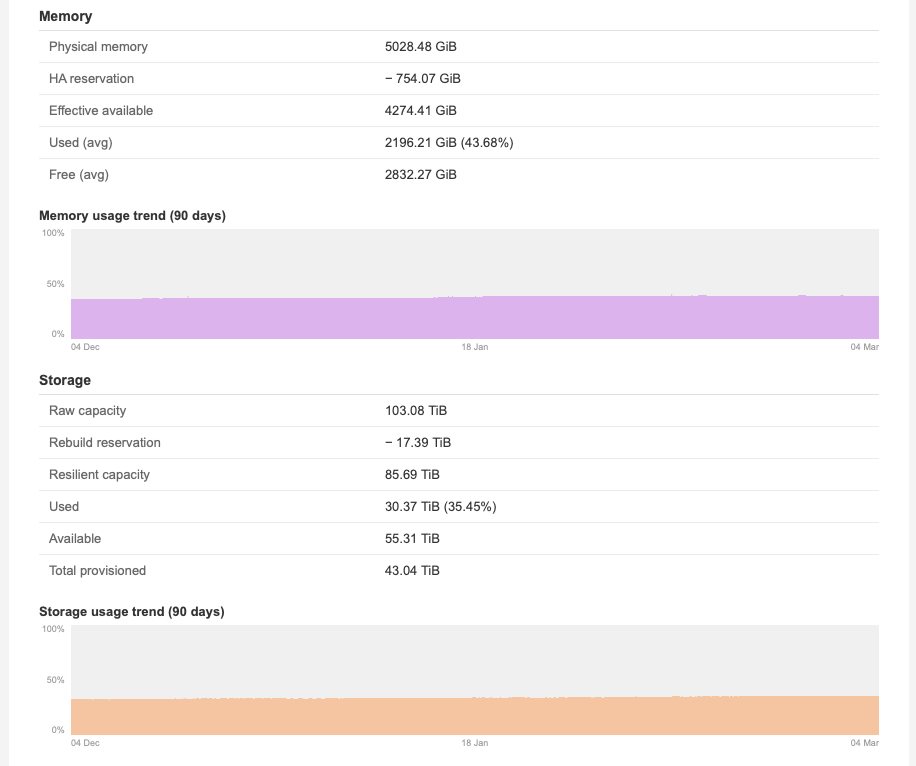
So, this is what the email looks like when it arrives in your inbox:
We have the Cluster summary with the number of VMs and CPU, Memory and Storage statistics with trend graphs.
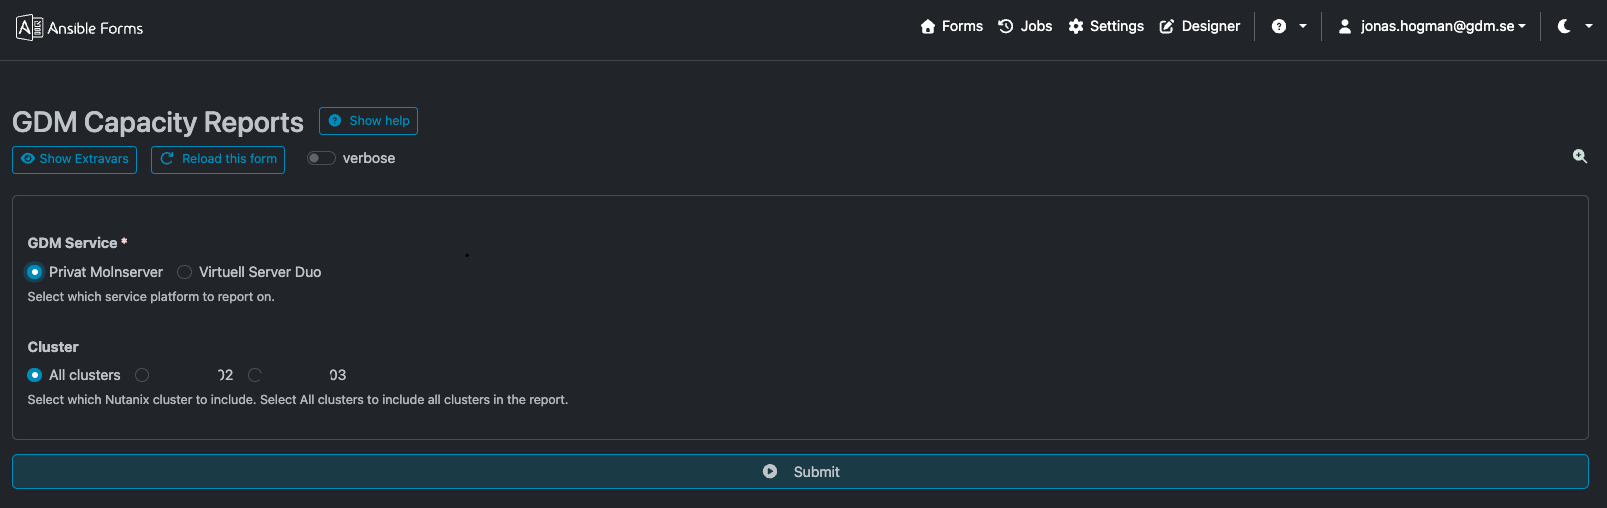
And I've created a workflow that makes sure my executives can log in to a web frontend, and with two or three clicks, they have the report in their inbox.
Hope this can be an inspiration to anyone. Thanks for reading!